Grafana Plugin
Published on March 7th, 2022Introduction
The Backstage Grafana plugin integrates with Grafana to list alerts and dashboards for your entities.
Prerequisites
You’ll need a Grafana account with an API key and the url of your Grafana UI and API (if different).
Adding the plugin
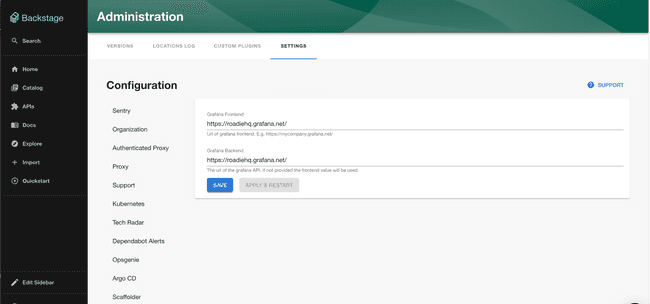
Configure the Grafana endpoints
Configure the Grafana endpoints to use via Administration -> Settings -> Grafana. If you’re using grafana.net your
frontend and backend endpoints should be the same e.g. https://<your-company>.grafana.net/. If you’re using hosting
Grafana yourself you’ll need to specify a url to the frontend which is used by backstage to generate links and an API
endpoint which the plugin uses to query alerts and dashboards.
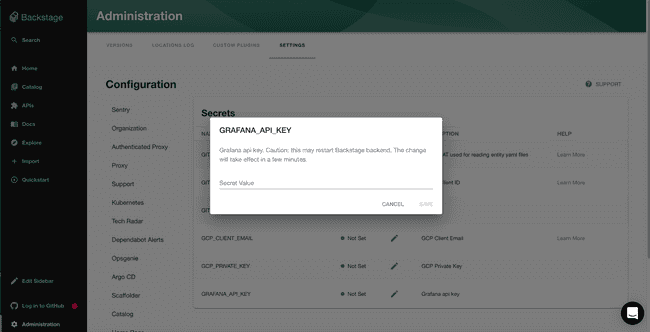
Add the Grafana secrets
First, add the GRAFANA_API_KEY secret via Administration -> Settings -> Secrets. Note you’ll
need to wait for the secret to be marked as “Available” before you can use the Grafana plugin.
Add the plugin to the UI
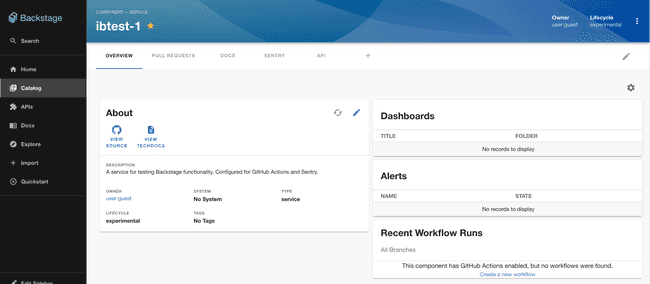
The Grafana plugin provides two components which can be added to the Backstage UI. You must be a Backstage admin to add components to the UI.
The EntityGrafanaDashboardsCard and EntityGrafanaAlertsCard components can be added to catalog dashboards. These
list dashboards and alerts respectively.
Set the Grafana annotation on entities
The Grafana plugin uses an annotation to link entities in the Backstage catalog to data in Grafana. This annotation should have a tag in Grafana as its value. Any alerts or dashboards with this tag will be displayed once the annotation is set and the components added to the UI.
Make a PR to the following to your catalog-info.yaml file:
annotations:
  grafana/tag-selector: "my-grafana-tag"

